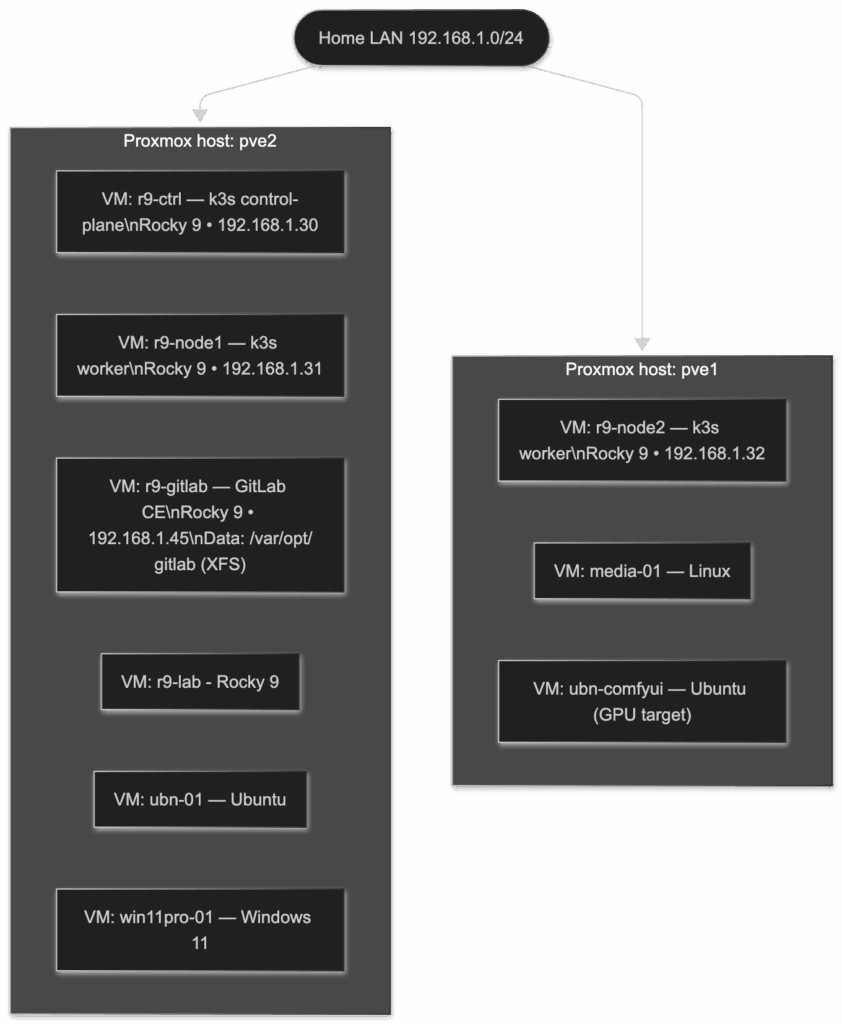
The first diagram is the “steel and wires” view: two Proxmox hosts on your 192.168.1.0/24 LAN, each carrying a tidy stack of VMs. pve2 is the busy one, home to the k3s control-plane (r9-ctrl at .30), the first worker (r9-node1 at .31), and your standalone GitLab VM (r9-gitlab at .45 with data mounted at /var/opt/gitlab). It also runs general-purpose boxes like an Ubuntu VM and a Windows VM. pve1 balances the other side with the second k3s worker (r9-node2 at .32), a media VM, and an Ubuntu machine earmarked for GPU/ComfyUI work. Everything sits on the same flat network so services are reachable without any NAT games, while GitLab stays outside the Kubernetes blast radius for easier upgrades and backups.
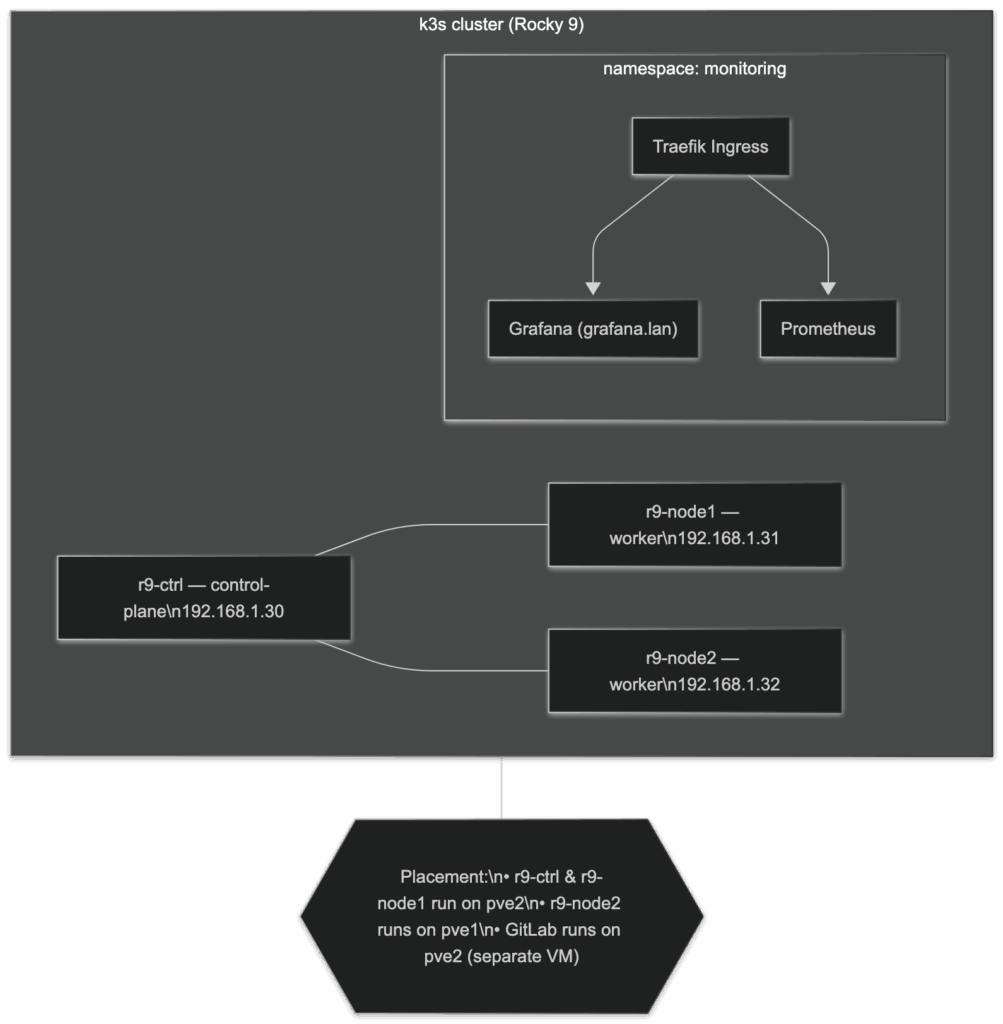
The cluster is one control-plane + two workers: control-plane on r9-ctrl, workers on r9-node1 and r9-node2. It’s the stock k3s stack (containerd runtime, flannel networking, ServiceLB). Monitoring is deployed in the monitoring namespace via kube-prometheus-stack: Prometheus, node-exporter, kube-state-metrics, and Grafana. Traefik is the ingress controller, and grafana.lan resolves to the Traefik ingress so the Grafana UI is reachable inside your LAN. All three nodes are reporting Ready, and Grafana/Prometheus are up behind the cluster IPs you listed.